Overview of a text report in work area
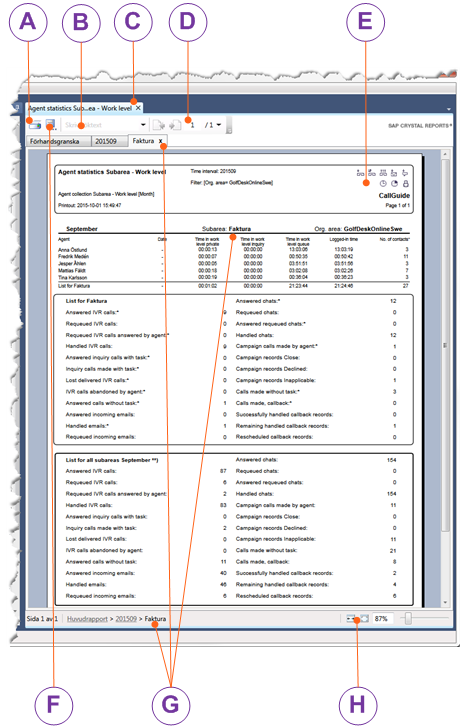
 Print
Print If there is a printer installed at your computer you can print the content of the selected tab, the same way as you normally print from your Windows environment.
 Search
Enter letters or figures that are being included in what you are looking for. If needed, select, in the list opened by the arrow, whether you searched text shall be case sensitive or for just exactly what you have entered
 Tabs
Tabs
Several reports can be open simultaneously. They can be different reports or the same report with different parameters. To close a report you click on the cross to the right of the report name. Choose which one of the opened reports you want to see by clicking the appropriate tab, or in the list opened via the

small menu arrow farthest to the right
 Skim
Skim
Buttons take you to the next page or back to the previous page. The figures indicate which page you see and how many pages there are in the report. By the

arrow you can opt to skim to the first and last page respectively.
The Report Header described below.
 Export report
Opens a window where you point out where the file is to be saved, you name it and choose a file format..If you want to be able to display it again in
CallGuide Report, use the .rpt format. Other available formats are.pdf, .doc, .xls, .rtf and .xml.
Drill down
Most reports contain statistics at several levels; the deeper you drill down into the report, the more detailed the information becomes. Where your cursor turns into a magnifying glass you can double-click to see the underlying level. Each time you drill down into the report, a new tab is created, with a name corresponding to the value you have chosen to click on. The top level of the report is the Preview tab. At the bottom you see how deep down into the structure you are. There you click on the level you want to see, or on the current tab. Close a level by clicking on the cross to the right of the tab name.
Adjust report view

Adjust the width to the window

Show as full screen

Pull the control to zoom
Content of the report header
How a report is set up and how data are presented is entirely dependent on what the report shall account for. However, all reports presented in CallGuide Report have in common a report header. This is how to interpret the header content
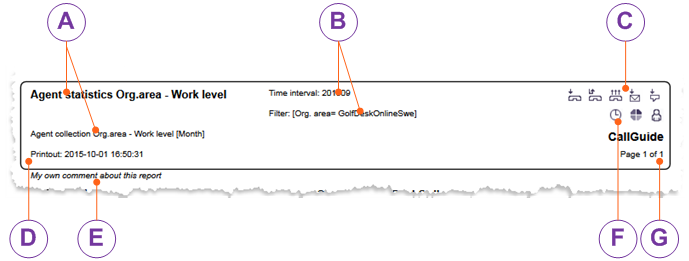
The complete report name, describing here from which perspective the statistics is shown and the statistics collection the report has been based on.
Here you see the parameters the report is based on, i.e. the time unit, the time interval and the filters selected in the Filter settings area.
The services presented in the statistical report are seen here as icons:

Incoming telephony

Callback

Campaign

Incoming e-mail

Incoming chat
Printout time is the time when the report was generated for display.
Here you see the comment you can enter in a separate field under Filter settings.
Here you see information about the statistical report's various levels as icons:

Organisation area

Subarea

Time interval

Queue/waiting list

Agent

Task
Which page of the report you see and the number of pages included in the report.